So not wasting more time here is brief introduction to Ollydbg.
As the name itself suggests OllyDbg is debugger and disassembler for Microsoft Windows PE(Portable Executable) files (32-bit) . According to the author , Oleh Yuschuk, OllyDbg is a 32-bit assembler level analysing debugger for Microsoft Windows. Emphasis on binary code analysis makes it particularly useful in cases where source is unavailable. The current version of OllyDbg cannot disassemble binaries compiled for 64-bit processors.
OllyDbg is one of the very important tools for reverse engineering of executables. Also it allows one to change the instructions or statements in the executable while running it. Some more features are:
- One can trace registers, find loops, switches, API calls,
- Loading and debugging DLLs
- Allows to add your own comments and labels on the functions.
- Attaches to running programs
- Finds references to constant or address range
- Allows breakpoints to be set at desired places and API’s
- Hardware breakpoints
- Shows the strings in the executable
- Shows the API calls used
- Allows to take dump of the process
- Allows to move the program control wherever specified by the user
- Step-by-Step debugging the program ....
You can download it from here: http://www.ollydbg.de/
When you run ollydbg.exe you will see a window like this :
 | |
| OllyDbg |
ToolBar Buttons:
- Open button : It loads a file in Olly for debugging. You can use the shortcut key F3 to load a file or just drag-and–drop the file into olly.
- Restart/Re-Load button : It reloads the last debugged executable in ollydbg(Ctrl+F2).
- Close button : Closes the currently loaded executable(Alt+F2).
- Run button : Runs the debugged application(F9).
- Run Thread button : It runs the currently loaded thread(F11).
- Pause button: It pauses the currently loaded executable(F12).
- Step-Into button: It steps in or goes into the current function(F7).
- Step-Over button: Same as above, but it executes the call/function at once instead of going into it and executing it step by step(F8).
- Trace Into button: Same as Step-into button but it works with the run trace and is slow(Ctrl+F11).
- Trace-Over button: Same as Step-over button but it works with the run trace and is slow(Ctrl+F12).
- Execute till return button: It continues stepping into the executable until it reaches a return statement(Ctrl+F9).
- Execute till user code: It will continue stepping into the debugged executable till it finds user code(not system functions).
- Log window: It opens a log window(Alt+L).
- Executable modules window: It lists all executable modules currently loaded by debugged executable. This window also shows other information about loaded modules like module size, entry point. Module version, path, etc(Alt+E).
- Memory map window: It displays the memory blocks allocated by the debugged executable. It contains the sections of the debugged executable and other sections of the dll’s that are loaded by the debugged executable, type of block, access rights(read, write, execute), initial access, size and memory address whe the section is loaded(Alt+M).
- Thread window: It displays all the threads in the debugged executable. Every executable has at least one thread. We can select the thread we want to suspent, resume , kill or work on (Alt+T).
- CPU Window: This is the window where the assembly code of the debugged application is shown(Alt+C).
- Runtrace Window : For backtracing program execution.It logs addresses, contents of registers, messages and known operands to the run trace buffer.
- Breakpoints Window : This window shows the breakpoints(INT3) that one has put on the debugged application(Alt+B).
- Memory Breakpoints window: It shows the memory breakpoints (Alt+Y).
- Hardware Breakpoints window: This window shows hardware breakpoints (Access, write, execution) in the debugged application(Alt+H).
- Options window : In this window one can set various ollydbg options like fonts, colors, appearance, etc.
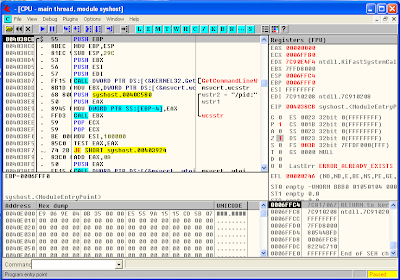
When a file is loaded in ollydbg, one can see four separated areas/fields viz, disassembly, dump, stack and registers, as shown below:
 | |
| File Opened in Ollydbg |
The disassembly section contains the disassembled code of the loaded executable for debugging purpose. In this window there are four columns. The first column displays the virtual address of the current instruction to be executed. The second column displays the opcodes of the current instruction. An Opcode (operation code) is the portion of a machine language instruction that specifies the operation to be performed. Every instruction in assembly language has atleast one opcode associated with it. Ollydbg takes these opcodes, which form machine language, and disassembles them into equivalent assembly language code making it easy to understand and debug. The third column in this window displays the assembly language code for the opcodes in second column. The fourth column displays the comments for the current instruction. User can also add his own comments to the line of code by double-clicking on the comments column or by pressing semicolon (;) key or by right clicking on the code and selecting add comment option.
The dump section displays the contents of the data section or simply data of the loaded binary in hex and in ASCII.
The Stack section shows the contents of the stack which is the data pushed for performing intended operations. it also contains the return addresses where the program control will return after calling a function. A stack is a Last-In-First-Out (LIFO) data structure, which means the last element pushed on to the stack must be the first one to be removed(pop).
The Registers section further has three sub-sections as : registers, flags and floating point registers as shown below:
 | |
| Ollydbg Register section |
Registers hold values for variables. The contents in registers can be changed by double clicking it. The flag registers are used to indicate the program that something has happened as a result of comparison operation, etc. The value of a flag can be changed by double-clicking it. The floating point registers are used when the arithmetic operations are performed by the CPU.
When we right–click on the disassembly window in ollydbg, we can see the context menu as:
 |
| Disassembly right click menu |
This was an introductory blog. I wont be teaching you in Ollydbg in more detail. You will learn as you go. Or if you want to learn before Ollydbg before going any further you can refer to blog: http://thelegendofrandom.com/blog/sample-page
And the most important thing about Ollydbg is the more you will use it, the more you will come to know about its features.
If you want more detailed tutorial or tutorial related to any other Malware Reversing topic just ask in comments and i will try to do that ASAP.
Many many thanks to Rakesh for simple and very informative article.
Thank you, keep it doing next posts please!
ReplyDeleteThanks for a nice article. Will you plz include any video based advanced tutorial that could provide a deep usage understanding...
ReplyDeleteI want to use the result of OllyDbg (disassembly code, Registers value, API calls...) as a file which will be an input for another program (my program to analysis virus), Can I do this?
ReplyDeleteYou can use context menu option Copy->Select All then Copy->To file to save disassembly in file and similarly to get api calls Search for->All Inter-modular calls then Copy to Clipboard -> Whole table and save in text file. as register values are dynamic they can change depending upon code execution you cant save them.
Deletekindly provide me step by step tutorial of malware reverse engg. in debugger...
ReplyDeletekindly help me
a detailed introduction, thanks very much!
ReplyDeletechecking in for 2023 this some fire heat!!
ReplyDelete